

TL;DR: Jump to our non-statistical summary!
We often struggle with bugs, bad practices, non modular architecture. In previous posts, we keep mentioning Conway’s law to show the correlation between system design and company communication channels:
Any organization that designs a system (defined broadly) will produce a design whose structure is a copy of the organization’s communication structure.
Conway’s law
Until this moment, few studies tried to quantify the correlation between the company structure and code quality, which is the exact scope of this Microsoft 2009 paper: The Influence of Organizational Structure On Software Quality: An Empirical Case Study
In this post, we will go through the paper main parts, illustrating how bad your structure in the team can influence bad practices and how you can fix it.
Why did we need this paper?
Windows vista wasn’t the best from stability standpoint, which required deep research on the reasons. Before this paper, we knew there are some relationship between code architecture and company structure (conway’s law), also, our favorite 70s book “Psychology of computer programming” mentioned a lot of relationships between processes and factors that can eventually contribute and result in a bad quality. From the 70s to now, there haven’t been a scientific paper that measured this correlation in a quantitative way, so this paper in 2009 was the first serious try to connect multiple factors together. Hopefully Twitter can understand the lesson and avoid the same fate as Windows Vista.
Does organizational complexity influence quality? If yes, how?
Mythical Man Month is one of the most well known books about correlation between some organization practices and software delivery, like how hiring new people to meet deadlines is actually bad, and how any attempt to fix irreducible errors tends to result in the introduction of other errors, it gave a lot of information about the problem, with very little backing scientific research about quantifiable correlation.
Some managers get really confused and sometimes even lost finding a root cause for the bad code quality: “We have top notch experienced developers, we give high salaries, we have an ordered backlog and planning calls but still the software quality is bad” they think to themselves. This is a very similar situation to Fail of Babel tower, where they had everything they needed; but the tower eventually fail. In Babel story.
How previous papers approached the problem of software quality?
A lot of previous researches tried to correlate code quality with multiple code-related metrics, can be categorized in the following groups:
Churn
Churn involves the rate of code changes, to put in that into measurable numbers, previous papers selected the following metrics:
- Number of code changes (New code, edited code, deleted code)
- Age of code
- Lines of code
Complexity
Code complexity is a big topic, to put it into measurable metrics, some old papers decide to use the following metrics:
1. Weighted methods per class
2. Coupling between objects
3. Depth of Inheritance
4. Number of Children
5. Response for a class
6. Lack of cohesion among methods (Not correlated)
Dependencies
1. Some papers only relied on the dependencies, those papers proved that by checking only dependencies, you can identify failure-prone binaries with accuracy of %73
Code Testing Coverage
Other papers proved that choosing the correct test cases the give higher coverage are much better than randomly selected tests.
Bugs history
- History of previous bugs, the more the bugs in history, the more the bugs in present.
- Pre-release bugs (How would findings reported even before release can indicate the code quality)
So the above are the main metrics older papers analyzed, those old papers used a specific metric to find the correlation with one metric or a combination of metrics.
What is really unique about this Microsoft paper were the metrics it used, which is purely non-coding organizational metrics. Something that a lot of companies ignore and never second-look at why a bad structure can be a direct cost of bad quality.
Before exploring Microsoft’s paper
We will do small change to the paper terms; a binary in the paper will be represented with the term feature (As more than one feature can be worked on in a single binary) and the word master ownership organization will be replaced by the owning entity.
Entity here means team, department (More than one team) or something bigger (Multiple departments).
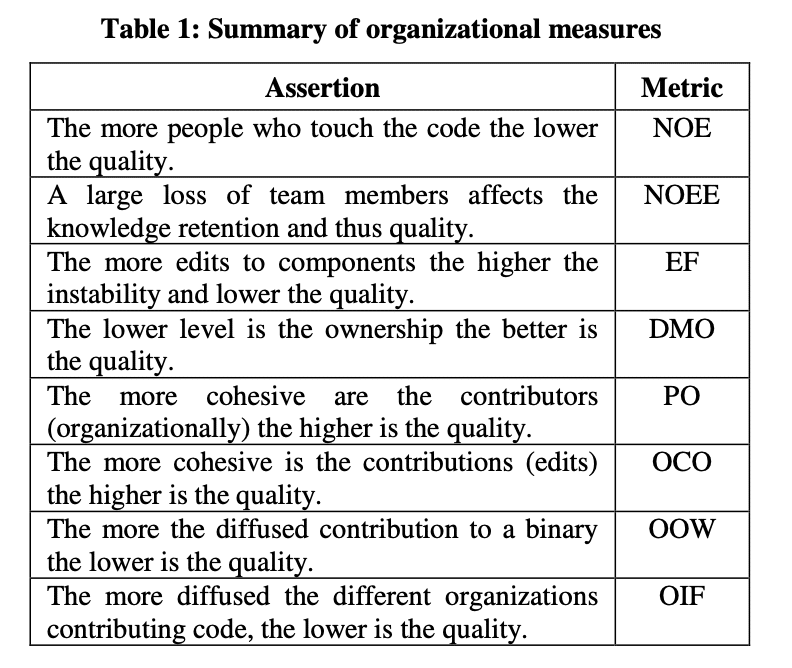
Metrics Microsoft’s paper explores
Number of Engineers
So, the question on that side is, if we expanded a team of 16 into a team of 32, would we expect the software quality to be better or worse? The answer to that is, the more the team member the higher probability you will end up with worse software (Quality wise). A logical explanation to that is, for a team to communcation where everyone is communicating to everyone else, we have N(N-1)/2 communication paths. Where N is the number of Engineers. (Check the graph). This takes us to Scrum magic size (3-9).
Solution
If you have a big team, just split it out. But keep in mind that you need to split the teams into feature teams instead of component teams.
Number of Ex-Engineers
This is one of the biggest problems Twitter might start suffering of.
This is the number of Engineers that worked on the software but left the company. The correlation detected by the paper was that the more people that leaves, the worse the quality. As the new Engineers will never have the same level of knowledge around the code no matter how good the knowledge transfer is.
Solution
Try your best to maintain developers turn-over to the lowest, also make documentation a part of your process, in case someone decided to leave, documentation can represent most of their knowledge not just explanation of the code but also reasoning behind the decisions. With that being said, try to keep your team intact.
Edit Frequency
This is similar to the code churn mentioned above, where we measure the number of edits done on the source code but the difference here is we don’t care about number of lines (Added/edited/deleted) but this is a pure measurement of commits. Only commits. With commits the paper also analyzed the commit authors (Whether ex engineers or current ones) and history distraction of the edits. The finding of that metric is very logical as well, the more changes the code has, the higher probability the code has issues, but this can be a single-engineer issue or a specific-team where they are struggling with specific parts of the code.
Depth of Master Ownership
This metric is a bit harder to explain. We need to find out the distribution of ownership of parts of code and how deep is this ownership, where owner entity is defined by doing 75% of the changes to a specific part. For example: if an organization has departments, and each department has teams, and each team has multiple developers. In that case, we can find owners of specific parts of the code by calculating specific part (or a feature) ownership of 75%. So for feature A, if a team directly contributed alone 75% of the code, this team is deemed the owner of the feature, if the team did less than 75% we go one level up, for example: if team A contributed 30% and team B contributed 45%, and both teams are part of a department, then that department is the code owner. Logically, if a feature requires only one team to work on it end to end, this is much better. Try to go as deep as you can on ownership where teams or even developers don’t rely on each other to work.
Solution
Please abandon component teams as soon as possible. It never works in startups, combine your teams into feature teams and make sure those team owns their part with least dependency on sibling teams or higher management to complete their part. We have seen a lot of startups where it’s not department ownership even but a whole organization ownership to deliver a simple feature, as no single team or even department owns 75% of the code for that feature, which means multiple departments with a lot of teams and a ton of developers are needed to complete a change, this causes a total loss of ownership.
Percentage of organization contributing to development
This is similar to the previous point, we calculate the number of people in the ownership entity and we divide it by the total number of developers, so for example, in the previous example, if team A which did 75% of a feature had 7 developers, and the whole organization had 50 developers, then the value would be (7/50)%. What you should aim is always lower number. Because that means ownership is divided on low number of developers which is always recommended.
Solution
If you got a high number of Engineers in a single organizational unit, try to distribute the unit into smaller teams, and try to convert them to fully cross-functional feature-teams so they can be the master owner of the feature and deliver it in whole while not requiring a large number of Engineers to deliver.
Level of Organization Code Ownership
How much of changes are done by the owning entity? The entity here again can mean a team, department or a whole organization. “The more the development contributions belong to a single entity, the more they share a common culture, focus, and social cohesion. The more diverse the contributors to the code itself, the higher the chances of defective code”. To calculate this value, just divide the total number of code changes done by the owning entity by the total number of changes. The higher this value the better.
Solution
Let’s combine the above three points, ownership of feature changes should be deep (Belong to teams not departments), should be narrowed to specific number of team members (The less the better), and this low number of team members should own as much as possible out of the code.
Overall Organization Ownership
This is the ratio of people in the owning entity doing changes to the feature to the whole number of engineers editing the feature, the higher the value the better.
Solution
If you have low value here, you need to make sure your code is more modular and the product owners are trying to eliminate dependencies and assigning the features to the correct teams. The higher this value, the easier everyone can track their changes and test it without affecting someone’s else work.
Organization Intersection Factor (OIF)
How many entities did 10% or more of changes to a specific feature? The more the worse.
Solution
Same as the previous points, make sure your teams are feature teams instead of component teams, and make sure feature boundaries are well drawn. Keep in mind that the higher the intersection, the higher the risk of a small change somewhere breaking the whole thing, as those 10% entities don’t have the same high understanding of code as the owning entity.
Results
First, to match the paper, let’s give the above metrics abbreviations.
Now let’s see the correlation numerically (keep in mind this is a spareman’s correlation):
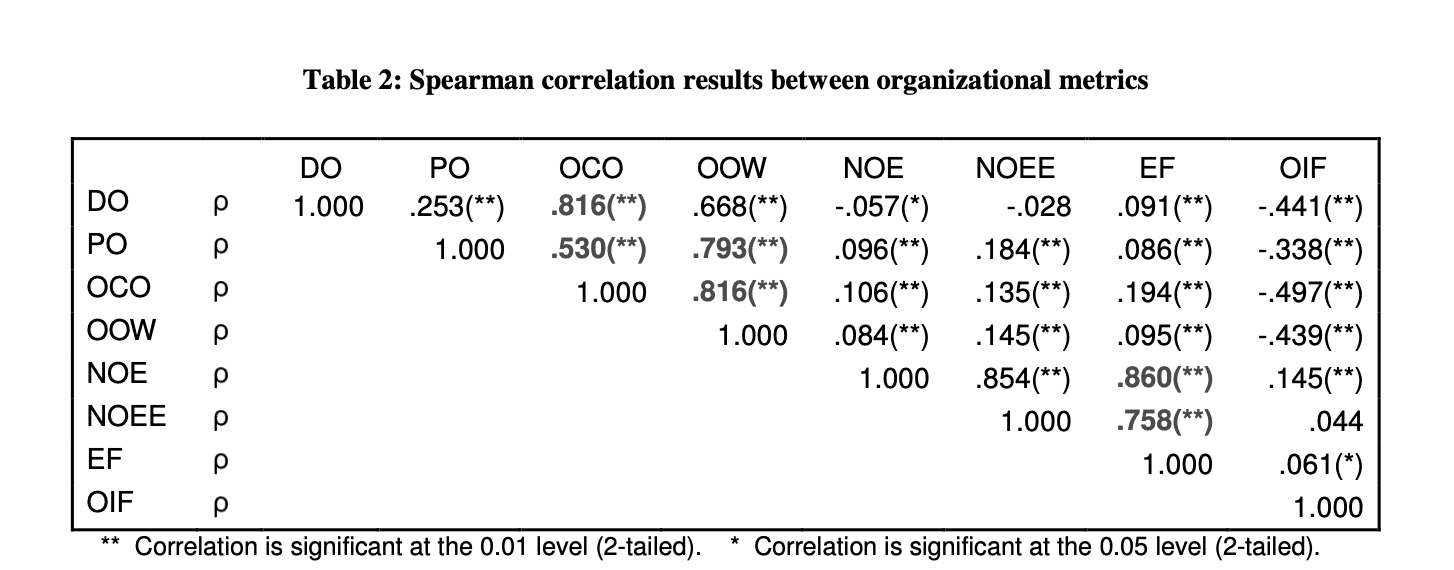
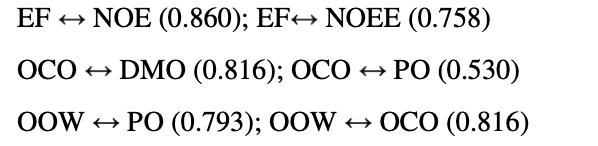
Out of those number, the highlighted ones represent the highest values:
Non-statistical summary
If you need a more of practical summary out of the great science mentioned in the paper, here you go:
Try to keep your teams as focused on specific features as possible, keep your code representative of this focus as well (modular and organized to represent features not components). You shouldn’t have more Engineers than you need, and at the same time make sure if you are letting someone go to get all the knowledge transferred to remaining team members. Keep the ex Engineers number as low as possible.
Also, how many changes are being made to the code? Do you see the number exaggerated? Are there some parts having much more changes than the others? Do you have bug loophole where fixing bugs introduce new ones? Refactor that part.
Then we move to the next important part, who is working on what. We recommend having ownership on teams levels, so each team can deliver features or full apps/binaries on their own, if more than one team needs to get involved, you are losing a lot of speed in the cross-team communication and you are losing a lot of ownership as well. You can calculate ownership by figuring out if a single team owns 75% of a specific feature or not, if not, calculate for a departement. Once you figure out the owning entity, figure out the following values and based on that do one of the following actions:
Observations:
- How deep this entity is? If it’s team-deep amazing, if it’s a higher level entity, do some changes.
- What’s the percentage of the number of owning team engineers to all engineers? Make sure they are more focused, the more cohesive they are, the better. So this value needs to be low.
- How much of the changes are done by the owning entity vs all other entities? The more the better.
- Outside of owners, how many contributing entities (Teams with more than 10% of changes)? Don’t make this number high, as it will make your code more prone to errors.
- What’s the percentage of the owning entity engineers to all the engineers doing changes to the feature? The higher the better.
Actions:
- Is your code modular enough? Is all the models/views/controllers in a single directory or you are splitting based on services/apps/modules? Make sure your code is as modular as possible and to represent your features, then assign teams based on that.
- Make your teams not less than 3 and not more than 9.
- Make your architecture as flat as possible, maybe a program manager followed by portfolio managers followed by product managers/owners is more than enough for thousands of team members. Then the deepest team is 4 steps away from program manager nothing more. If you have less than thousands team members, then you can do with just product managers/owners and the deep of a team from management isn’t that far away.


0 Comments